
The index alignment and data merging stage
Contents
3.2. The index alignment and data merging stage#
In this section, the alignment and merging steps are presented through an example.
%load_ext autoreload
%autoreload 2
import numpy as np
import pandas as pd
import matplotlib.pyplot as plt

from eensight.config import ConfigLoader
from eensight.methods.preprocessing.validation import validate_dataset
from eensight.methods.preprocessing.alignment import (
    get_hourly_timesteps,
    get_time_step,
    _align_by_value,
    _align_by_distance,
    align_to_index,
    merge_data_list
)
from eensight.settings import PROJECT_PATH
from eensight.utils import load_catalog

plt.style.use("bmh")

%matplotlib inline
3.2.1. Load dataset#
First, we load the catalog for one of the available datasets (the one with site_id="b03"):
catalog = load_catalog(store_uri="../../../data", site_id="b03", namespace="train")
Get and validate the raw input data:
features = catalog.load("train.input-features")
labels = catalog.load("train.input-labels")
def validate(data, feature_name):
    for name, load_fn in data.items():
        if name.split(".")[0] == feature_name:
            return validate_dataset(load_fn())
consumption = validate(labels, "consumption")
temperature = validate(features, "temperature")
holidays = validate(features, "holidays")
Check that the labels dataset has only one time step with duration that is less than one (1) day.
assert len(get_hourly_timesteps(consumption.index)) == 1
3.2.2. Align dataset#
If the labels dataset has indeed only one time step, its index becomes the primary index for all features. Alignment is needed only when features have different time steps than the labels (for instance, hourly temperature data, but 15-minute interval consumption data).
This is the case for this dataset:
print(f"Time step of consumption data: {get_time_step(consumption.index)}")
print(f"Time step of temperature data: {get_time_step(temperature.index)}")
print(f"Time step of holiday data: {get_time_step(holidays.index)}")
Time step of consumption data: 0 days 00:15:00
Time step of temperature data: 0 days 00:30:00
Time step of holiday data: 1 days 00:00:00
Index alignment is performed by the eensight.methods.preprocessing.alignment.align_to_index function.
For data that is numerical, align_to_index provides two (2) approaches for alignment. The first approach interpolates the data to match the primary index, the second matches the primary index on the nearest key of the feature’s index.
Both approaches are controlled by a tolerance parameter (pandas.Timedelta):
For the first approach,
tolerancedictates how far interpolation can reach. As an example, outdoor temperature changes slowly, so interpolating over 2 or 3 hours should not be a problem. Other features may change faster, and a shortertolerancemay be needed for them.For the second approach,
toleranceis the maximum time distance to match a timestamp of the input dataframe with a timestamp in the primary index.
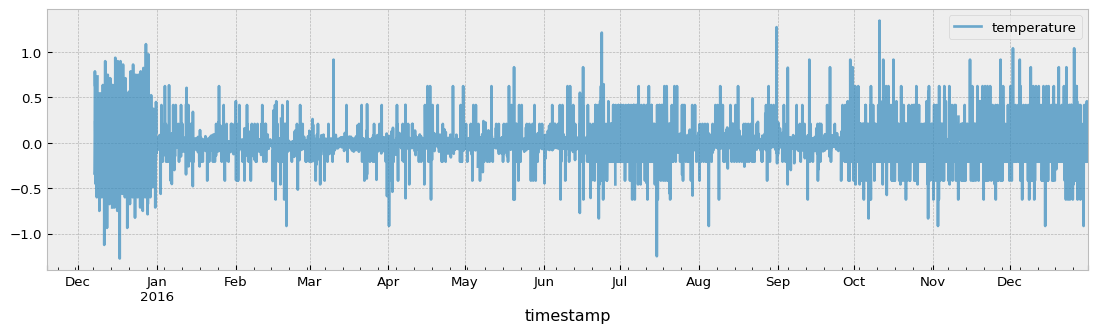
Alignment by interpolation:
temperature_aligned = align_to_index(
    temperature,
    consumption.index,
    mode="value",
    tolerance=pd.Timedelta(minutes=60*3)
)
assert temperature_aligned.index.equals(consumption.index)
original = temperature.resample("1H").mean()

aligned = temperature_aligned.resample("1H").mean()
differences = original - aligned
fig = plt.figure(figsize=(14, 3.54), dpi=96)
layout = (1, 1)
ax = plt.subplot2grid(layout, (0, 0))

differences.loc[aligned.index].plot(ax=ax, alpha=0.7)
Alignment by timestamp distance:
temperature_aligned = align_to_index(
    temperature,
    consumption.index,
    mode="distance",
    tolerance=pd.Timedelta(minutes=60*3)
)
aligned = temperature_aligned.resample("1H").mean()
differences = original - aligned
fig = plt.figure(figsize=(14, 3.54), dpi=96)
layout = (1, 1)
ax = plt.subplot2grid(layout, (0, 0))

differences.loc[aligned.index].plot(ax=ax, alpha=0.7)
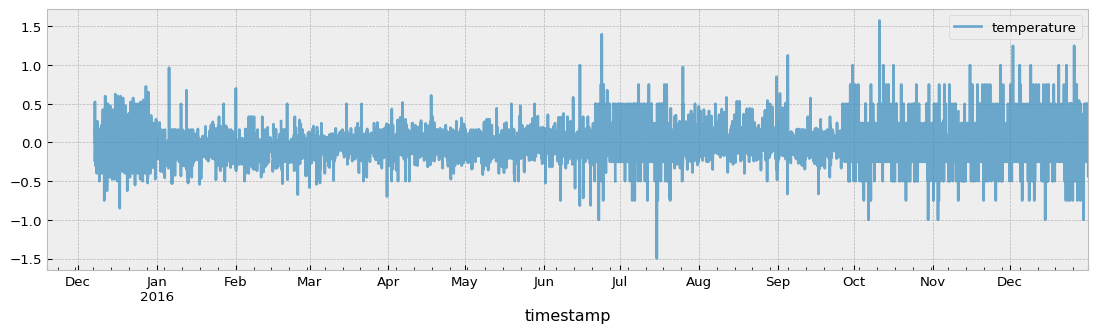
Although the differences are small, alignment by interpolation is more accurate than alignment by timestamp distance.
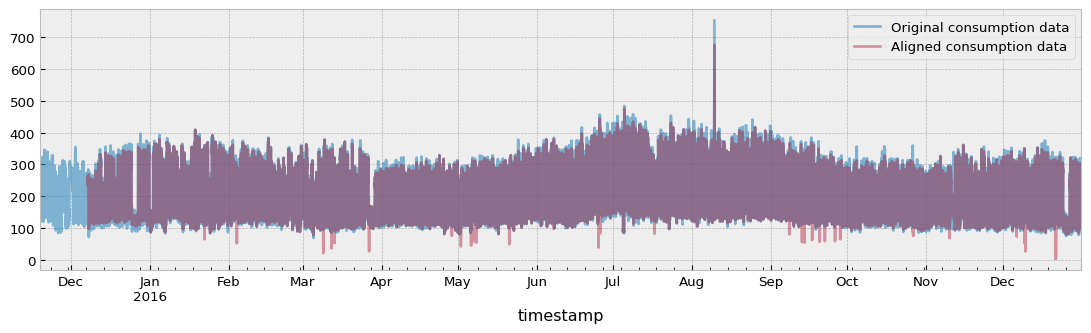
For data that is both numerical and cumulative, alignment is done by first calculating the cumulative sum of the feature to align, then applying the alignment method (by interpolation or by distance), and finally calculating the first discrete differences so that to reverse the cumulative sum transformation.
For demonstration purposes, we can align the consumption (which is numerical and cumulative) to the index of the temperature:
consumption_aligned = align_to_index(
    consumption,
    temperature.index,
    mode="value",
    cumulative=True,
    tolerance=pd.Timedelta(minutes=60)
)
[01/19/23 18:42:14] INFO Cumulative feature consumption normalized by time step length. alignment.py:197
Important Note!
When
align_to_indexaligns features to the labels’ index, any feature that is both numerical and cumulative will be normalized by dividing its value at any given timestamp by the number of minutes between this timestamp and the immediately preceding one. This is done so that to avoid misleading values when the primary index has time gaps.
original = consumption.div(
    consumption.index.to_series().diff().map(lambda x: x.total_seconds() / 60),
    axis=0
)
fig = plt.figure(figsize=(14, 3.54), dpi=96)
layout = (1, 1)
ax = plt.subplot2grid(layout, (0, 0))

original.plot(ax=ax, alpha=0.6)
consumption_aligned.plot(ax=ax, alpha=0.4)
ax.legend(["Original consumption data", "Aligned consumption data"])
Alignment of categorical features is always done by timestamp distance.
align_to_index can align daily data to sub-daily indices:
holidays_aligned = align_to_index(holidays, consumption.index)
This task does not need a tolerance parameter. The daily data is just repeated for every timestamp that corresponds to the relevant day:
holidays_aligned[holidays_aligned.index.date == holidays.index[-1].date()]
| holiday | |
|---|---|
| timestamp | |
| 2016-12-26 00:00:00 | St Stephen's Day |
| 2016-12-26 00:15:00 | St Stephen's Day |
| 2016-12-26 00:30:00 | St Stephen's Day |
| 2016-12-26 00:45:00 | St Stephen's Day |
| 2016-12-26 01:00:00 | St Stephen's Day |
| ... | ... |
| 2016-12-26 22:45:00 | St Stephen's Day |
| 2016-12-26 23:00:00 | St Stephen's Day |
| 2016-12-26 23:15:00 | St Stephen's Day |
| 2016-12-26 23:30:00 | St Stephen's Day |
| 2016-12-26 23:45:00 | St Stephen's Day |
96 rows × 1 columns
Finally, aligning sub-daily data to a daily index is not supported. This should be part of a feature engineering process and not a data preprocessing one.
The function eensight.methods.preprocessing.alignment.merge_data_list aligns all feature dataframes in a provided list if alignment is needed, and merges them into one features dataset:
mode = {"temperature": "value"}
tolerance = {"temperature": pd.Timedelta(minutes=60*3)}

merged = merge_data_list([temperature, holidays],
                         primary=consumption.index,
                         mode=mode,
                         tolerance=tolerance
)
assert merged.index.equals(consumption.index)
3.2.3. Parameters#
The parameters of this stage - as they can be found in the eensight/conf/base/parameters/preprocess.yml file - are:
params = ConfigLoader(PROJECT_PATH / "conf").get("parameters*", "parameters*/**", "**/parameters*")
{"alignment": params["alignment"]}
{
    'alignment': {
        'mode': {'temperature': 'value'},
        'tolerance': {'temperature': 180},
        'cumulative': {'temperature': False, 'consumption': True}
    }
}
These parameters can be changed from the command line. As an example, suppose that there is an additional feature solar_radiation and maybe tolerance for solar radiation should be only 15 minutes. In such a case, the following option can be passed to the command line:
--param alignment.tolerance.solar_radiation=15